FlowLine Automation
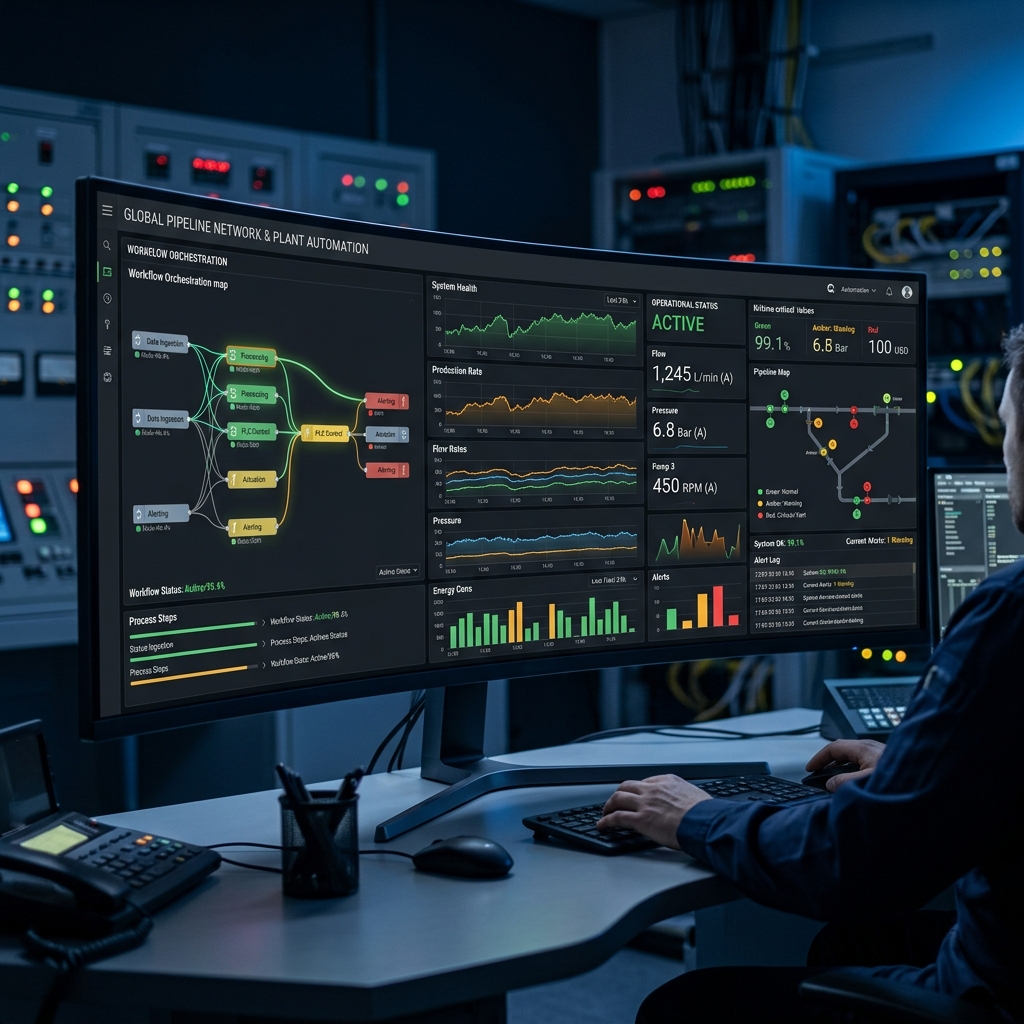
An enterprise automation dashboard that turns complex industrial workflows into visual narratives. Real-time monitoring, predictive maintenance, and operational clarity — all in a dark, focused interface.
FlowLine's operators were managing dozens of automated pipelines through spreadsheets and terminal windows. Critical alerts were missed. System relationships were invisible. They needed a single pane of glass that could show the entire operation without drowning anyone in data.
"Precision at scale."
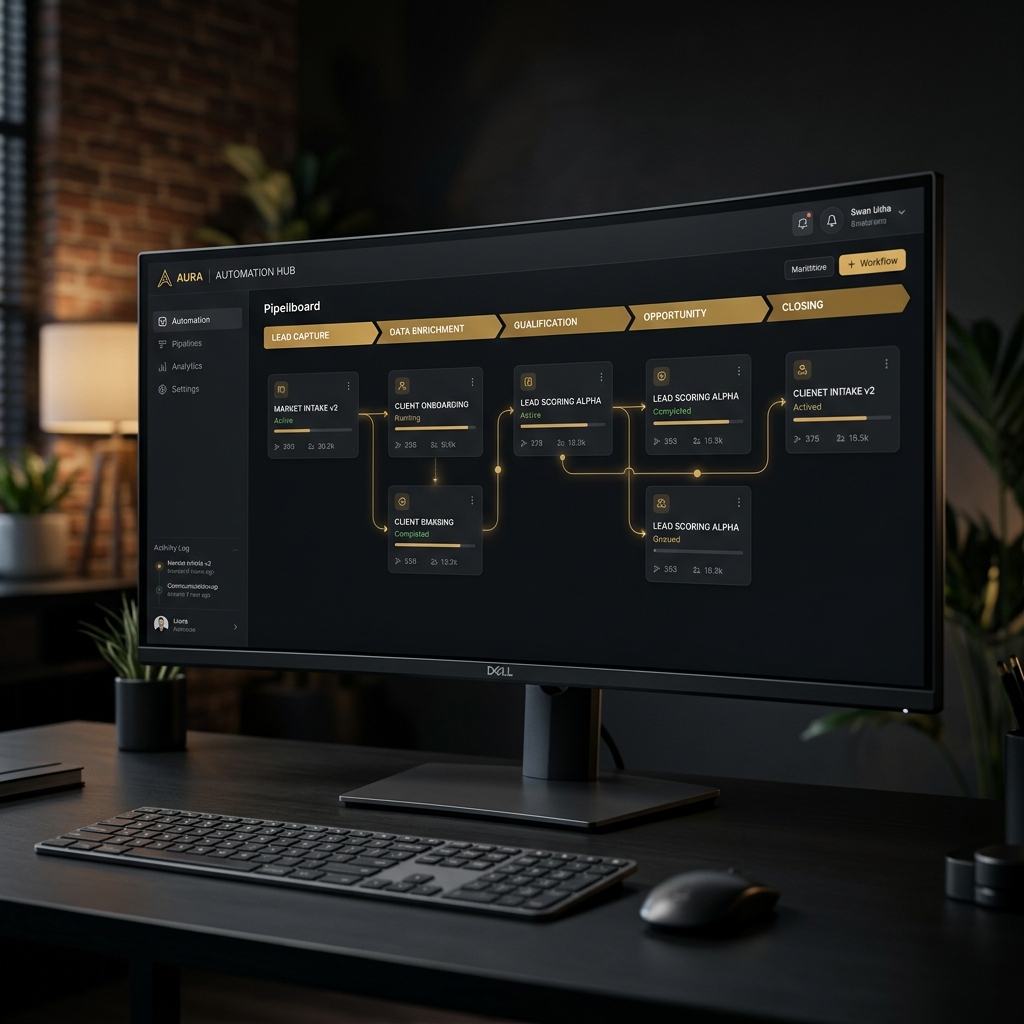
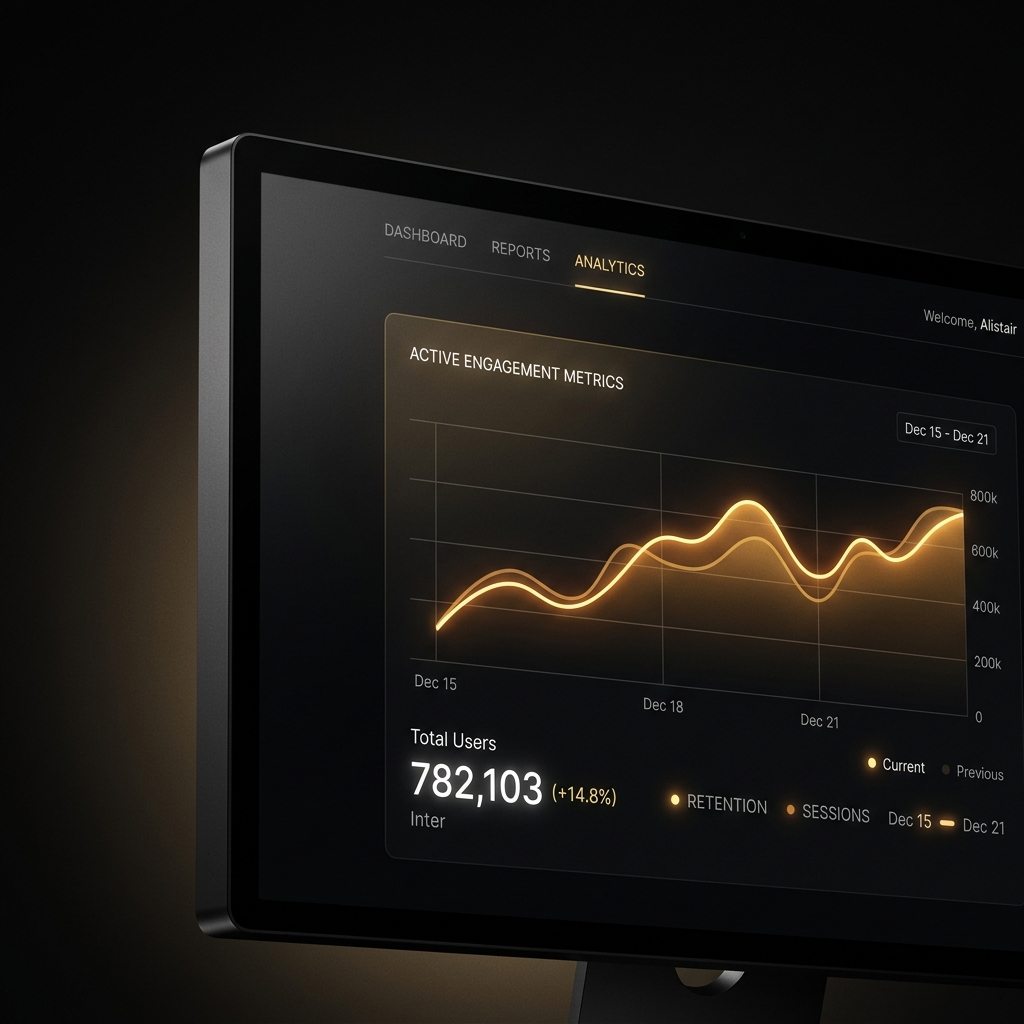
We built a visual language for industrial data. Each pipeline became a node in a flow diagram. Status uses color intuitively — green flows, amber pauses, red stops. The dark interface reduces eye strain during 12-hour shifts. Drill-down panels reveal detail without losing context of the whole system. Predictive alerts surface issues before they become failures.
Interactive preview — move your mouse
- Critical alert response time dropped significantly — issues are now visible before they escalate.
- Operators report reduced fatigue during long shifts — the dark, focused interface is easier on the eyes.
- New team members reach operational confidence faster — the visual system is self-documenting.
- The dashboard is now the command center for all three manufacturing facilities.
Atelier Brand Studio